The Aori dashboard has three primary sections: the performance graph, the campaign and account section and the sidebar.
This graph gives a summary of how all of the campaigns connected to Aori are performing. The available metrics are cost, clicks, CTR and CPC. These cannot be changed. While the graph provides a general overview of how the campaigns are performing, if the lines are hovered over, specific stats for specific dates will be displayed. Also there is a date picker in the top right corner to show stats for a specific date range.
.png?sizes=500px)
There are two tabs at the top of this section: campaigns and accounts. In the campaigns tab, the full list of Aori-made and non-Aori-made campaigns will be listed. They can be filterd based on status. The campaigns are displayed in the format of a card that will indicate the type of campaign (SKAGs, STAGs, etc.), the ad platform the campaign is connected to or intended for, the daily budget, last updated timestamp, performance stats or a progress bar if the campaign is still being built, a primary button to edit or do other actions to the campaign and a vertical three dot menu that offer auxiliary operations.
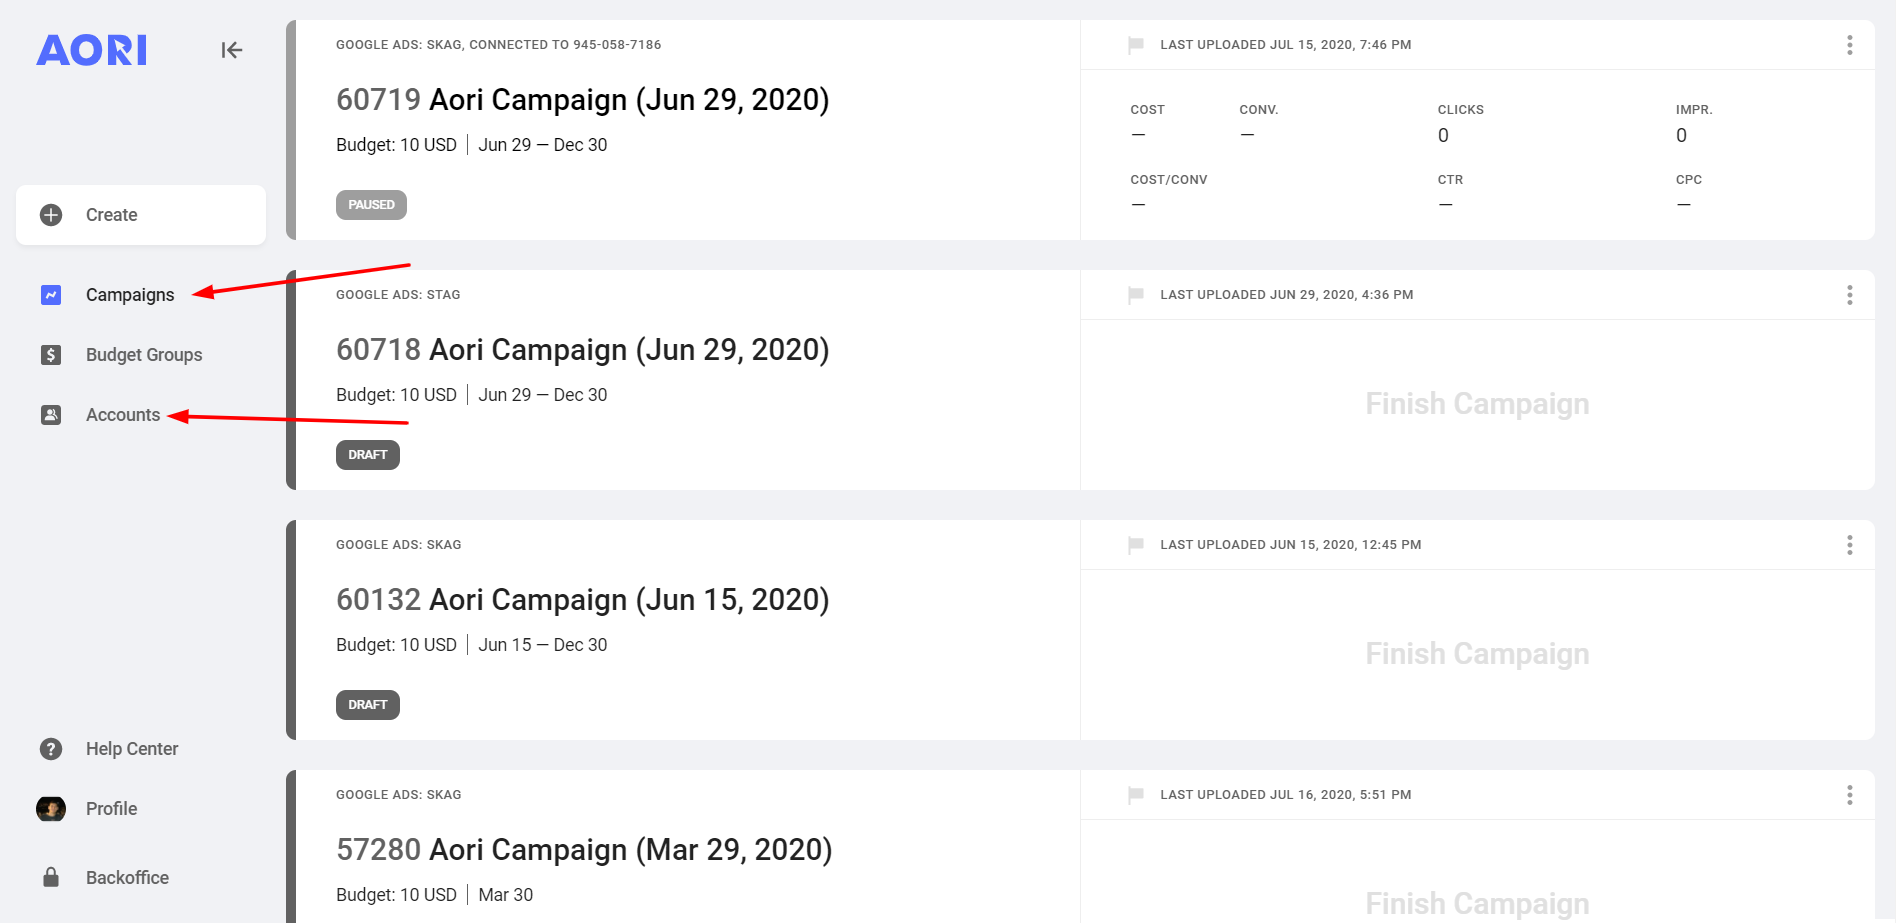
In the accounts tab, any connected accounts will be displayed. It is not possible to add accounts here. This operation is only done when uploading a campaign to an account. When an account is connected, Aori doesn't import all of the campaigns in this account. Aori only uses accounts as a potential source to upload Aori campaigns to.
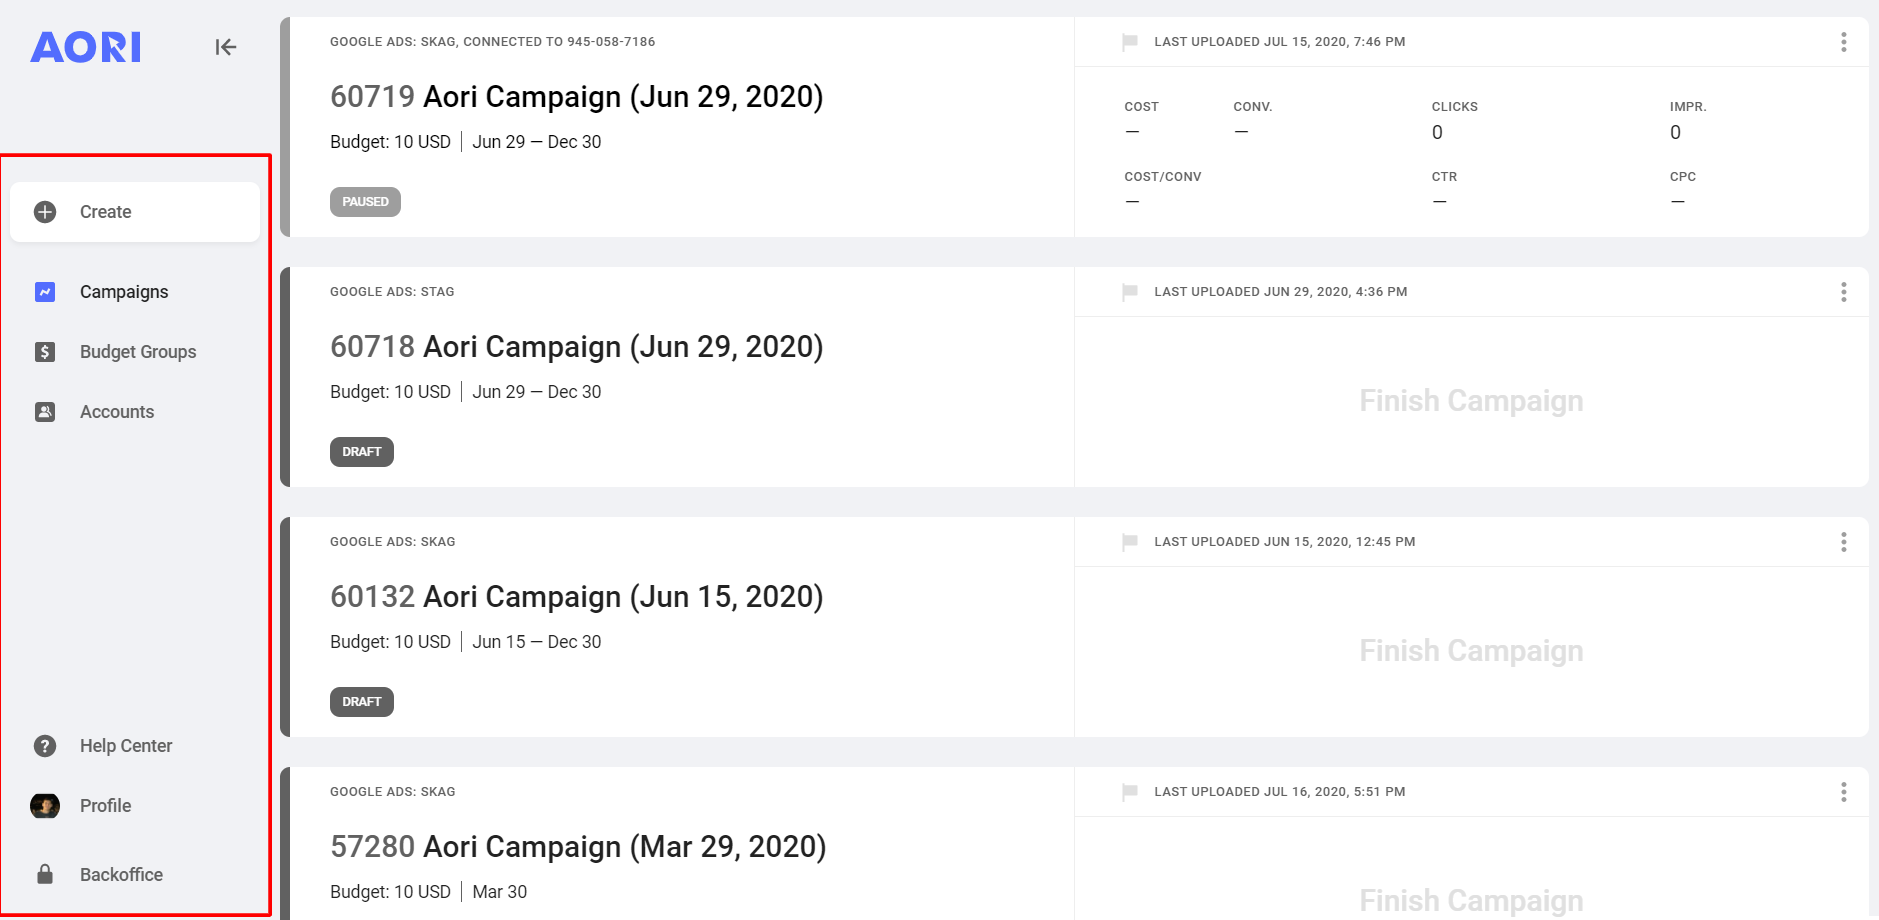
The sidebar helps users navigate to the campaigns, budget groups, accounts, help center and profile where you can update billing info, add team members, or invite new users to earn credit.
If you have any questions, Chat with us.
BACK TO The Aori Platform